Line Chart Animated Icon
Download in
Transparent GIF,
MP4,
JSON,
AEP,
LOTTIE,
and
tgs
formats
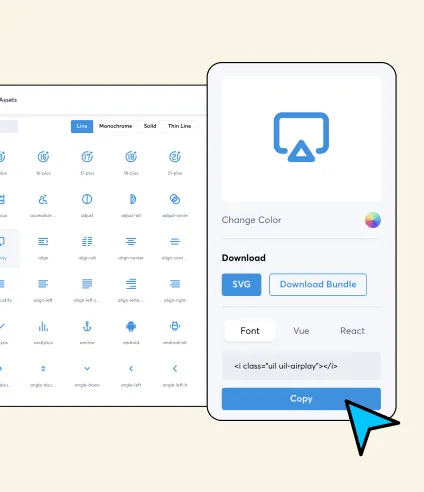
Available file format to download


Popular Animated Icons from Dynamic Graphs Animated Icon Pack
A mesmerizing line graph animation featuring two lines, one blue and one gray, representing changing values over time. Additionally, a circle tracks the values of one of the lines, providing a visual reference. Once the animation completes, it restarts for continuous visualization.
Trending Searches:
People Also Search:
Access the world's largest Design Ecosystem: Assets, Integrations, and Motion.