Bar Chart Animated Icon
By
Poritos Roy
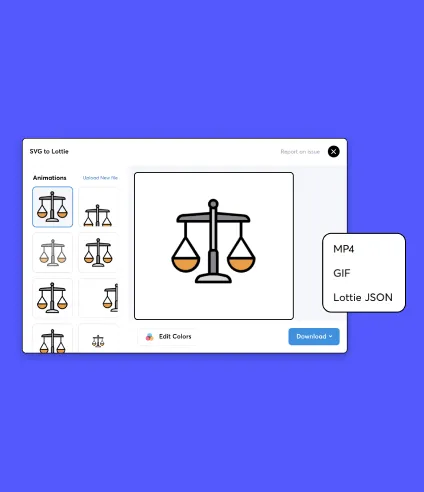
Download in
Transparent GIF,
MP4,
JSON,
AEP,
LOTTIE,
and
tgs
formats
Available file format to download

Popular Animated Icons from Business Animated Icon Pack
A Bar Chart Icon represents data visualization through the use of bars of varying lengths. Typically depicted as a series of horizontal or vertical bars, it symbolizes statistical information, analytics, and graphical representation. The icon serves as a visual tool for presenting and interpreting data trends, making it easier for users to understand and analyze complex information. Universally recognized, it is commonly used in business, finance, and research to visualize numerical data in a clear and concise manner.
Trending Searches:
People Also Search:
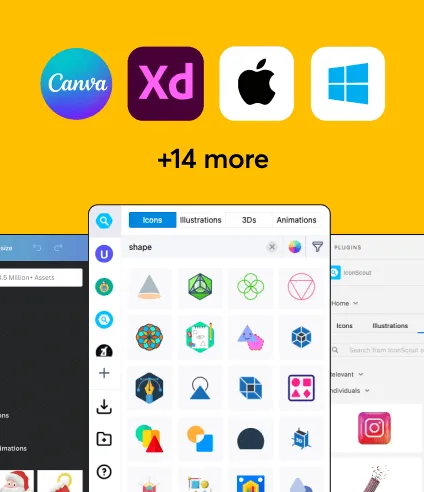
Access the world's largest Design Ecosystem: Assets, Integrations, and Motion.